- Home
- Commentary
- Navigating disinformation, uncertainty, individualism and the poison apple of conspiracy
- If nothing changes nothing will change: the Voice referendum
- What can we learn from disaster communities?
- New year, a time to embrace the uncertainty of it all
- We could be non-binary
- Adaptive resilience vs safety paternalism
- Left wing, right wing? What just happened to politics?
- Covid, class and the addiction to certainty
- Neoliberalism, the Life World and the Psychopathic Corporation
- Democracy is about our bodies, not just our minds
- What’s your motivation: is it yourself or the change you’re making?
- Mind over matter: The world of abstraction is driving us to destruction
- The real threats to our liberty and survival
- Avoiding the abyss of conspiracy theories
- The difference between a legal system and a fantasy novel
- What’s a conspiracy and what’s just common garden variety corruption?
- Unpredictability, humility and an emerging anthropandemic
- The trilemma – climate change, economic collapse, and rising fascism
- Happy New Normal for the decade ahead
- Fires, liars and climate deniers
- The race to the bottom in australian politics
- Talking about lock-on devices – an article in ‘The Conversation’
- The Ponzi scheme is teetering
- Regenerative culture a key part of the blockade experience
- Staying sane in the late Anthropocene
- Extinction Rebellion
- Major parties have failed on climate, it’s time to rebel.
- Elections In The Late Anthropocene
- It is the Greens that are defeating the Nats and it’s all about your preferences
- Australia’s powerhouse of democracy and innovation is in the Northern Rivers
- Is identity politics a problem for the left?
- The climate emergency and the awful state of Australian politics
- Democracy and rights under threat in corporate police state
- Liberty, freedom and civil rights? Do any of us understand these things anymore.
- The forest wars are back, time to mobilise
- …more commentary
- Workshops
- News & Events
- Media
- A Flood of Emotions – Sydney Ideas Event
- Participatory democracy in the COVID era – SCU podcast
- Activism educator Aidan Ricketts explains how and why protests can be peaceful
- Bob Brown Is Taking “Shocking” Anti-Protest Laws To The High Court
- Anti protest laws could arrest nannas, seize tractors
- “They blinked first”
- Colin Barnett quick to protest against ‘activism degrees’ – The Australian, 16/10/2014
- ‘Degrees in activism’ put brake on growth – The Australian, 15/10/2014
- Magistrate throws out vexatious police case against CSG protesters
- Outrage over school PR ‘by stealth’- The Northern Star
- CSG clash a certainty
- Communities use new tactics
- Gas group attacks lecturer
- …more media
- Activist Resources
- Reviews
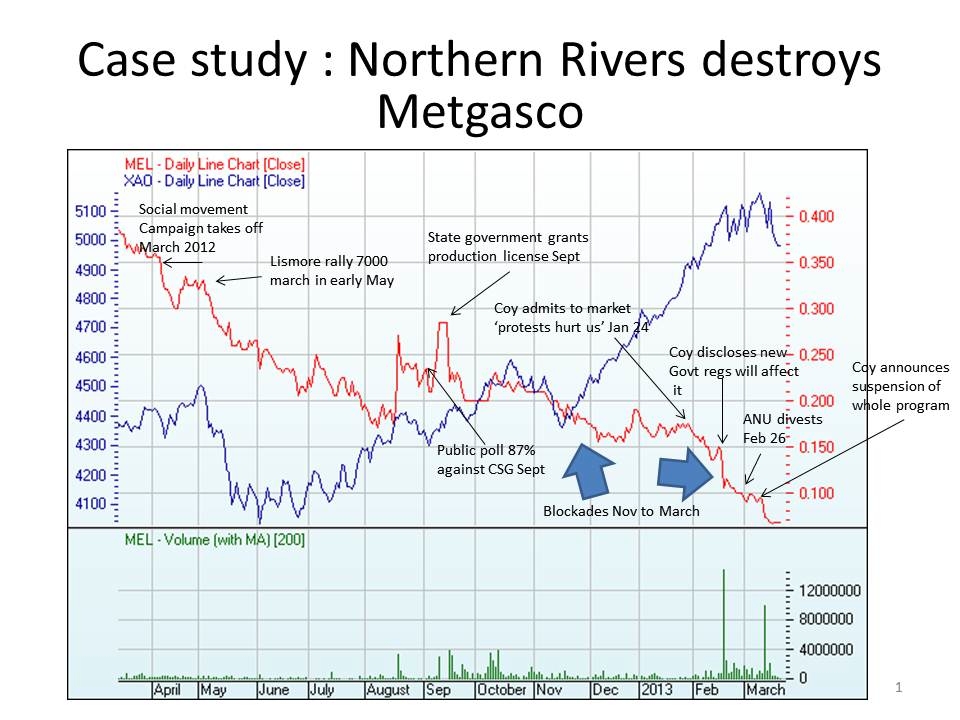
The market, in action.

Daily price chart of Metgasco shares over 12 months contrasted to Australian All Ordinaries performance over the same period. Price movements mapped against significant social movement events during the same period. Source: http://hfgapps.hubb.com/asxtools/Charts.aspx?asxCode=MEL&compare=comp_index&indicies=XAO&pma1=0&pma2=0&volumeInd=9&vma=0&TimeFrame=D12 Social movement data © A Ricketts 2013
Recent Posts
- Navigating disinformation, uncertainty, individualism and the poison apple of conspiracy
- If nothing changes nothing will change: the Voice referendum
- What can we learn from disaster communities?
- New year, a time to embrace the uncertainty of it all
- We could be non-binary about a lot more than gender
I like these sites
Community Organisations
- Code Green Tasmania
- CSG Free Northern Rivers
- Friends of the Earth Melbourne
- Generation Alpha
- Huon Valley Environment Centre
- Lock the Gate Alliance
- Nature Conservation Council NSW
- North Coast Environment Council
- North East Forest Alliance
- Plan to Win
- Rainforest Information Centre
- Save our Foreshore
- Still Wild Still Threatened
- The Change Agency
- The Wilderness Society


